
Welcome to my project repository. This project presents an end-to-end analysis of Cyclistic's 2024 bike-share trip data, focused on understanding how annual members and casual riders use the service differently and identifying opportunities to increase annual memberships.
The project follows the APPASA framework: Ask, Prepare, Process, Analyze, Share, and Act and combines SQL, MySQL, DuckDB, Python/Jupyter, and Power BI to take the analysis from business problem definition and data preparation through analytical exploration, visualization, and actionable business recommendations.
The repository documents the complete analytical workflow, including data ingestion and validation, SQL-based ELT processing, data cleaning and feature engineering, behavioral and business analysis, interactive Power BI reporting, and evidence-based membership growth recommendations. The final processed analytical dataset contains 5,851,692 trip records from the twelve monthly 2024 datasets.
- 📓 Complete Cyclistic Case Study Notebook (Kaggle)
- 🚲 Project Drive Folder
- 📄 Report PDF
- 🎥 Report Walkthrough Video
- 📊 Power BI Report File (.pbix)
Note: The Power BI (.pbix) file is provided through the project drive folder due to GitHub file size limitations.
This project analyzes Cyclistic's 2024 bike-share trip data to understand how annual members and casual riders differ in their riding behavior and identify data-driven opportunities to increase annual memberships.
The project follows the APPASA framework: Ask, Prepare, Process, Analyze, Share, and Act, providing a structured end-to-end analytical workflow from business problem definition to actionable recommendations.
The analysis involves:
- Data Preparation: Assessing the source, structure, variables, data quality considerations, governance, credibility, and suitability of the twelve monthly 2024 Divvy trip datasets.
- Data Processing: Implementing a SQL-first ELT workflow to ingest, validate, clean, transform, and feature-engineer the raw trip data into an analysis-ready dataset.
- Analysis: Using SQL and Python/DuckDB to examine rider behavior across ride duration, temporal patterns, bike usage, and station-level activity, with a focus on differences between members and casual riders.
- Data Visualization & Reporting: Using Power BI to transform analytical findings into an interactive, business-focused report covering ridership trends, rider behavior, station performance, and key membership opportunities.
- Business Recommendations: Translating the analytical findings into actionable strategies focused on converting high-engagement casual riders into annual members.
| Category | Tools / Technologies |
|---|---|
| Data Source | Divvy Trip Data - publicly accessible Amazon S3 data repository |
| Database & SQL | MySQL, DuckDB |
| Programming & Analysis | SQL, Python, Jupyter Notebook, Pandas, Seaborn, Matplotlib |
| Data Processing | SQL, ELT workflow, data validation, data cleaning, data transformation, feature engineering |
| Visualization & Reporting | Power BI |
| Documentation & Collaboration | GitHub, Kaggle, Google Drive |
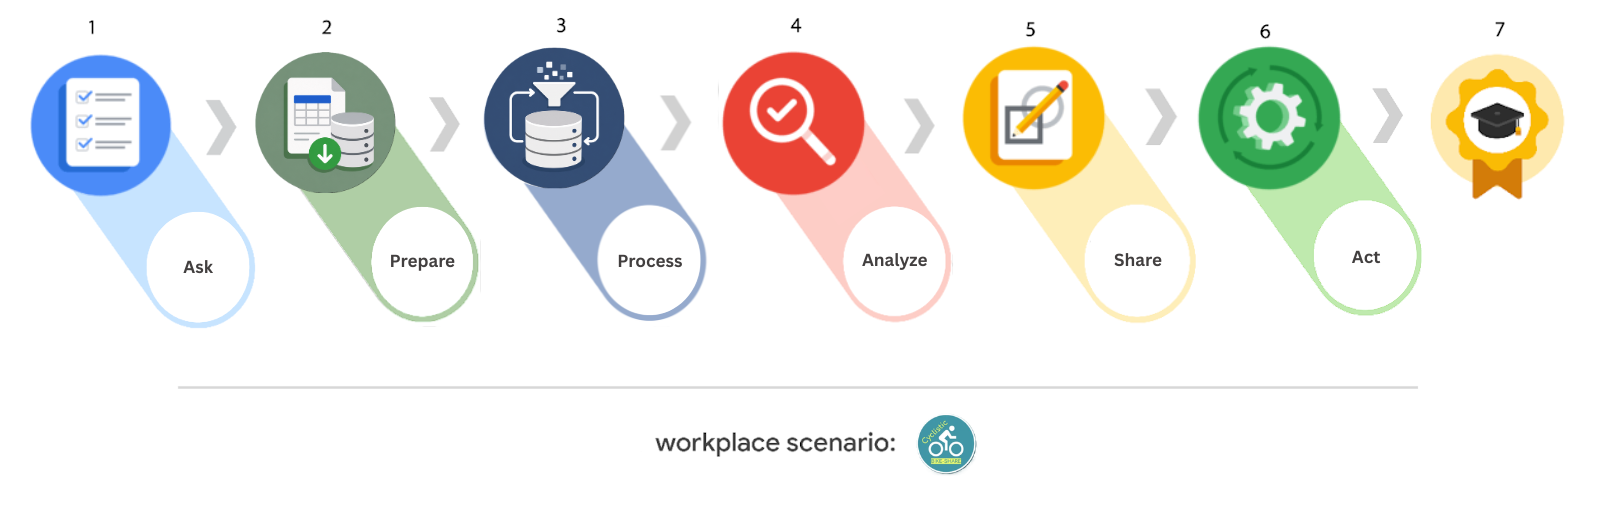
The project follows a structured APPASA: Ask, Prepare, Process, Analyze, Share, and Act workflow:
Ask → Prepare → Process → Analyze → Share → Act
- Ask: Define the business problem, project objectives, stakeholders, scope, and analytical questions.
- Prepare: Identify and evaluate the Divvy dataset, assess its structure, credibility, governance, limitations, and suitability.
- Process: Ingest and validate the twelve monthly 2024 datasets, perform data cleaning and feature engineering, and produce the analysis-ready dataset.
- Analyze: Examine differences between annual members and casual riders across temporal, ride-duration, bicycle, and station-level dimensions.
- Share: Communicate findings through an interactive Power BI report and supporting visualizations.
- Act: Translate the findings into actionable strategies designed to increase annual memberships through casual-rider conversion.
The analysis uses twelve monthly Divvy trip datasets covering January–December 2024. The datasets contain anonymized trip-level records describing ride characteristics, timestamps, station information, geographic coordinates, bicycle type, and rider classification.
The complete raw datasets are not stored in this repository. A dataset preview is included for reference, while the complete datasets are accessed through the project's external data source.
The final processed analytical dataset contains 5,851,692 validated trip records.
-
SQL Scripts: Dedicated SQL scripts for the Process and Analyze stages, documenting the data ingestion, validation, cleaning, transformation, feature engineering, and analytical queries used throughout the project.
-
Jupyter Notebook (.ipynb): Complete analytical notebook documenting the Cyclistic Rider Behavior Analysis workflow, including data exploration, validation, SQL-based analysis, analytical findings, and supporting analysis.
-
APPASA Project Documentation: Comprehensive documentation covering the complete Ask, Prepare, Process, Analyze, Share, and Act workflow, including the project proposal, executive summary, overall APPASA strategy document, and individual stage strategy documents.
-
Dataset Preview: A representative CSV file containing a preview of the Cyclistic dataset used to support documentation and demonstrate the dataset structure without storing the complete raw 2024 trip data in the repository.
-
Power BI Report Assets: Supporting Power BI report screenshots and individual page PDFs covering the Executive Overview, Rider Behavior Analysis, Ride Location Analysis, and Strategic Recommendations sections of the report.
-
Power BI Report PDF: Complete static PDF export of the four-page Power BI report for convenient offline viewing and reference.
-
Report Walkthrough Video: Full user-interaction demonstration of the Power BI report, showcasing report navigation, filtering, visual interactions, and the overall reporting experience.
-
Supporting Analysis Files: Additional project resources supporting data exploration, validation, analysis, and report development.
The Power BI report was developed to compare the riding behaviors of annual members and casual riders and translate the analytical findings into actionable membership growth opportunities.
The report includes:
- Executive Overview – 2024 ridership trends, key rider metrics, and member vs casual comparisons.
- Rider Behavior Analysis – Temporal, ride-duration, and bike-type patterns across rider segments.
- Ride Location Analysis – High-demand start and end stations and differences in station usage between members and casual riders.
- Strategic Recommendations – Key findings, business recommendations, and opportunities to convert highly engaged casual riders into annual members.
The report combines interactive visualizations with business-focused analysis and storytelling, enabling stakeholders to explore rider behavior and identify potential membership growth opportunities.


The analysis identified distinct behavioral patterns between annual members and casual riders across ride duration, time of use, seasonality, and station activity. These differences reveal specific opportunities to position annual memberships more effectively and encourage highly engaged casual riders to convert into members.
-
Casual Riders Take Longer and More Leisure-Oriented Trips
- Casual riders have a substantially higher average ride length than annual members (20.9 minutes vs. 12.2 minutes).
- Casual riders are more strongly represented across the 20+ minute ride-duration categories.
- Longer and extended rides are more common among casual riders, indicating stronger leisure and recreational usage.
-
Members Show Predictable Commuter-Oriented Usage
- Member activity is consistently higher throughout the workweek.
- Member ridership shows prominent peaks during typical commuting periods, particularly 6–9 AM and 4–7 PM.
- Casual riders show stronger weekend activity and a more evenly distributed riding pattern.
-
Seasonal Demand Creates Membership Conversion Opportunities
- Overall ridership increases substantially during the warmer months.
- Casual riders account for a larger share of riding during the spring and summer period.
- Annual members maintain comparatively consistent usage throughout the year.
- The peak riding season therefore represents an important opportunity to engage highly active casual riders.
-
Rider Segments Differ in Station Usage
- High-demand start and end stations show different usage patterns between members and casual riders.
- Several popular stations have substantially higher casual-rider activity, providing potential locations for targeted membership marketing.
- Station-level ride duration also varies considerably, highlighting locations associated with longer recreational trips.
-
Promote Leisure-Oriented Membership Value
- Develop scenic-route campaigns targeted at recreational riders.
- Introduce weekend ride challenges, rewards, and engagement campaigns.
- Emphasize membership benefits for longer and leisure-focused rides.
Goal: Position annual memberships as valuable for frequent recreational riders, not only routine commuters.
-
Reduce Membership Commitment Barriers
- Explore weekend-only or other flexible membership options.
- Consider seasonal and monthly membership offerings.
- Introduce short-term trials or flexible ride bundles to encourage casual riders to experience membership benefits.
Goal: Make the transition from casual riding to membership easier for riders who may not be ready for a long-term commitment.
-
Target Peak Conversion Opportunities
- Concentrate membership campaigns during the warmer riding season.
- Run weekend and leisure-focused promotions when casual ridership is strongest.
- Target high-traffic stations with strong casual-rider activity.
- Use afternoon and leisure-oriented engagement opportunities to reach casual riders when their usage is highest.
Goal: Reach casual riders during the periods and locations where engagement and potential conversion opportunities are strongest.
The strongest membership growth opportunity is to convert highly engaged casual riders into annual members by positioning membership as a flexible and cost-effective option for riders who already demonstrate high engagement through longer rides, weekend usage, warmer-season activity, and frequent use of popular recreational or high-demand stations.
├── Cyclistic Bike Share Member vs Casual Rider Behavior Analysis Documents
│   ├── All Stages - APPASA Strategy Document.pdf
│   ├── Cyclistic Bike Share Member vs Casual Rider Behavior Analysis Executive Summary.pdf
│   ├── Cyclistic Bike Share Member vs Casual Rider Behavior Analysis Project Proposal.pdf
│   ├── Stage-1-Ask-APPASA Strategy Document.pdf
│   ├── Stage-2-Prepare-APPASA Strategy Document.pdf
│   ├── Stage-3-Process-APPASA Strategy Document.pdf
│   ├── Stage-4-Analyze-APPASA Strategy Document.pdf
│   ├── Stage-5-Share-APPASA Strategy Document.pdf
│   └── Stage-6-Act-APPASA Strategy Document.pdf
├── Data
│   └── Cyclistic Dataset Preview.csv
├── Power BI Report Assets
│   ├── Images - Cyclistic Member vs Casual Rider Behavior Analysis in Power BI
│   │   ├── Cyclistic Executive Overview Page-1.png
│   │   ├── Cyclistic Report - Rider Behavior Analysis - Page 2.png
│   │   ├── Cyclistic Report - Ride Location Analysis - Page 3.png
│   │   └── Cyclistic Report - Strategic Recommendations - Page 4.png
│   ├── PDFs - Cyclistic Member vs Casual Rider Behavior Analysis Report in Power BI
│   │   ├── Cyclistic Report - Executive Overview - Page 1.pdf
│   │   ├── Cyclistic Report - Rider Behavior Analysis - Page 2.pdf
│   │   ├── Cyclistic Report - Ride Location Analysis - Page 3.pdf
│   │   └── Cyclistic Report - Strategic Recommendations - Page 4.pdf
│   └── Supporting Files
│       └── Cyclistic_Data_Exploration_and_Validation.ipynb
├── SQL Scripts
│   ├── Stage-3-Process.sql
│   └── Stage-4-Analyze.sql
├── Cyclistic_Bike_Share_Member_vs_Casual_Rider_Behavior_Analysis.ipynb
├── Power BI Report PDF - Cyclistic Bike Share Member vs Casual Rider Behavior Analysis Report.pdf
├── Video - Power BI Report - Cyclistic Member vs Casual Rider Analysis Report - Full User Interaction Demo.mp4
└── README.md
This project analyzes 2024 rider behavior, identifies meaningful differences between annual members and casual riders, and develops data-driven recommendations to support membership growth.
Through the structured APPASA workflow, the project progresses from defining the business problem and preparing the dataset through data processing, analysis, interactive Power BI reporting, and strategic recommendations. The analysis demonstrates how rider behavior across time, ride duration, bicycle usage, and station activity can be translated into actionable business insights and targeted opportunities for converting casual riders into annual members.
The completed project demonstrates an end-to-end, reproducible analytics workflow that combines SQL-based data processing and analysis, Python-supported validation and exploration, and Power BI-based visualization and business storytelling to transform raw bike-share trip data into evidence-based recommendations.