
Hobat is a cache-first Thread network dashboard and command-line toolkit. It
collects data from dataset sources like OTBR ot-ctl, the OTBR REST API, Home Assistant Matter
Server, mDNS, Eve exports, and Thread Tools exports, then presents topology and
table views in a browser.
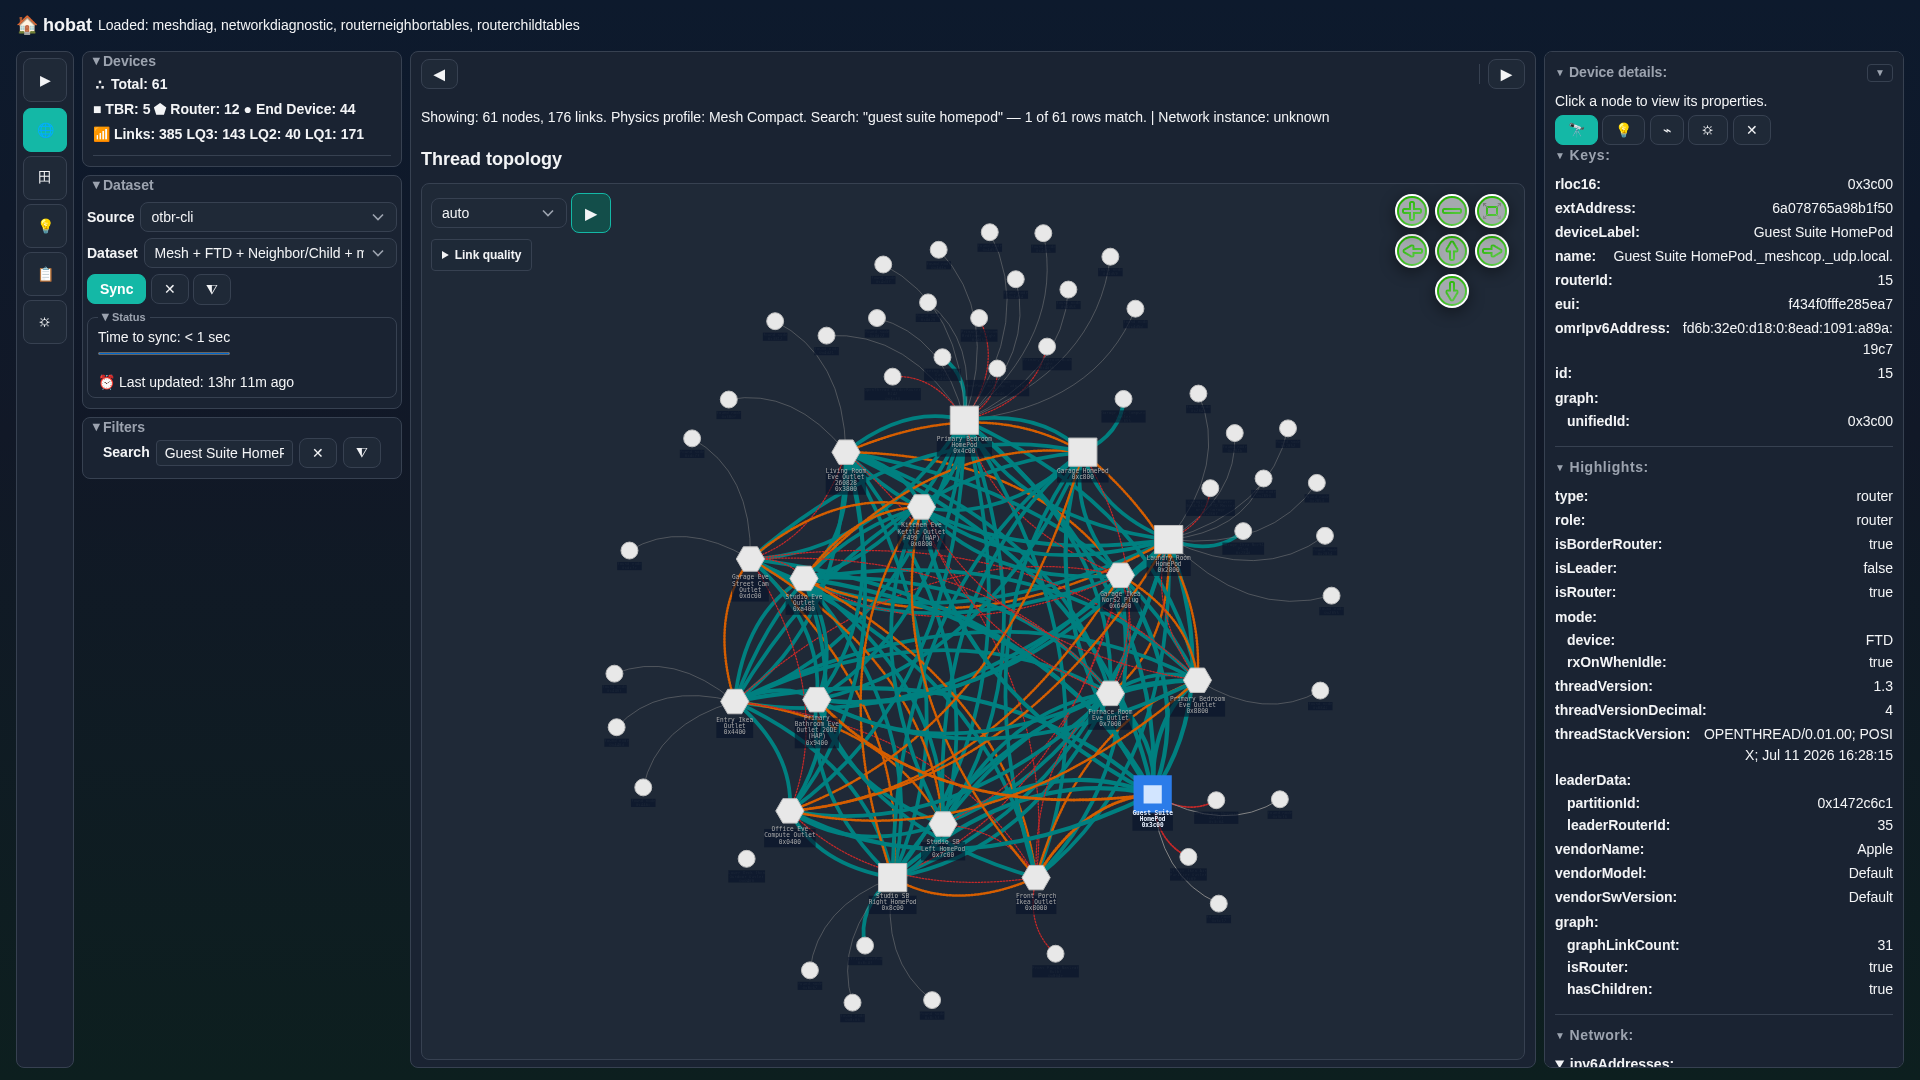
- Interactive topology and sortable table views.
- Multiple visualization physics profiles for topology layout: mesh compact, mesh ring, mesh tree horizontal, mesh tree vertical and hub spoke.
- Datasets sources supported: OTBR CLI, OTBR REST, Home Assistant Matter, mDNS, Eve, Thread Tools and merged datasets.
- Cache-first model keeps routine analysis off the live mesh. Long diagnostic collections can consume time and battery, especially on sleepy end devices, so run them deliberately or schedule them (cron) for quiet periods.
- Canonical identity (rloc16, extAddress) and field normalization across source formats.
- Atomic snapshot writes and source-level collection serialization.
- Progressive rendering from
.partial.jsoncheckpoints during long jobs. - Cache-only, Direct-Refresh and Auto browser modes.
- Cancellable background collection jobs.
- Bounded in-memory browser activity logs and a unified pending-jobs view.
- Search and capability-driven node, link, and diagnostic filters.
- Editable device labels stored in the configured data directory.
See Codebase Overview, Webpage and Server Data Flow, CLI Reference and Screenshots

- Python 3.11 or newer. Also tested on Python 3.14. Tested on Debian.
- Dependencies from
requirements.txt. - An OTBR instance for live OTBR collection for
otbr-cliandotbr-restapicollection. - Optional Home Assistant Matter Server for
ha-matter-wscollection. - Docker access when using the default container-based
ot-ctlpath.
Optional operator-managed inputs in data directory include:
Eve Thread Network Layout.evethreadlayoutfrom Eve appdiagnostics.jsonfrom Thread Toolstd-static-extaddr-device-label.json
Install development and test dependencies from the repository root:
python3 -m venv .venv
source .venv/bin/activate
python3 -m pip install -r requirements.txt -r requirements_test.txtAll tools use one effective data directory, resolved in this order:
--datadir DIRTD_DATA_DIR/datawhen that directory exists./dataunder the current working directory
The local default is created when needed. See Data Directory Model.
mkdir -p "$PWD/data"
export TD_DATA_DIR="$PWD/data"From the repository root:
PYTHONPATH=src python3 -m td_webserver --host 0.0.0.0 --port 9165 --datadir ./dataOpen http://localhost:9165/. The root redirects to /tdash.html.
On startup the dashboard does not fetch a dataset until Sync is selected. Default is Auto. Enable Cache Only before Sync to not trigger live collection. Force Refresh requests regeneration. Long actions return a background job that the browser polls and can cancel.
For a health-eligible dataset, the Refresh Health control in Network
Insights processes the currently loaded cached snapshot with partial input
allowed. It writes health history in hobat_v1.db, but does not collect source
data, update snapshots, or probe devices.
Set TD_DEBUG_LEVEL to DEBUG, INFO, WARNING, or ERROR (case-insensitive;
surrounding whitespace is ignored) for either entry point. CLI precedence is
--debug/-d > --verbose/-v > TD_DEBUG_LEVEL > INFO; --debug wins if
both switches are supplied. Invalid values exit with status 2 only when no
CLI level switch overrides them.
TD_DEBUG_LEVEL=' debug ' PYTHONPATH=src python3 -m td_cli --datadir ./data otbr-restapi devices listDEBUG can show HTTP traffic and ot-ctl diagnostics, but Thread Network Key
and PSKc values are redacted from REST success/error response-body logs,
captured child output, and active-dataset stdout by default. The explicit
--log-thread-secrets switch opts into those values only in OTBR REST DEBUG
response-body logs. It does not change stdout, snapshots, or non-REST logs.
On the webserver it is forwarded only to REST data jobs. Use this opt-in only
with controlled process-log access and retention.
The device summary's Health: control opens Network Insights. Its adjacent health status control optionally colors topology node borders from the current assessment; coloring is off by default, is not persisted, and resets when the active dataset changes.
Network Insights opens on Findings and offers three peer tabs: Findings, Comparison, and Device Roster. Each tab keeps its filters, selection, disclosures, pagination, and table position while switching tabs or using Show in table and Return. The assessment summary is labeled Selected assessment; it describes the pinned Findings/Roster assessment, not an arbitrary comparison pair or necessarily its After endpoint.
Device Roster shows a searchable, sortable, paginated inventory for the selected stored assessment. Presence defaults to Observed and describes that assessment, not network health; the separate roster designation reflects the current operator-managed state. Missing and Offline come from stored assessment findings, not device age. Selecting a device opens its stored facts in the details panel. On desktop the roster includes stored address and inventory facts alongside the existing columns, with sortable headings. On mobile the table stays compact with Device and Presence; select a device to inspect all facts and their freshness/conflict metadata in the details panel. Table values are network-scoped last-known facts and do not necessarily describe the pinned assessment or certify freshness; use Data quality and device details for evidence quality. Missing values display as Absent.
From Findings or Device Roster, confirmed per-device actions can enroll an observed untracked device, mark an expected device intentionally offline, clear that designation, retire a tracked device, or unretire a retired device. These actions update the expected roster and reassess retained evidence; they do not collect data, change snapshots, or rewrite historical assessments. Enrollment does not update the static label map. The same lifecycle changes are available through the health CLI; see Thread Network Health for transitions, idempotence, audit, retention, and API details.
The Comparison tab offers 1D, 3D, and 1W as the primary choices; each resolves its baseline against the latest retained After assessment. The default is 1D. Custom reveals independent Before/After selectors for any retained assessment pair and is collapsed until opened. Selecting a preset after a historical Custom choice returns to the latest After. The 1M control is not shown; its server candidate resolution and automatic 30-day persistence remain unchanged. Partial assessments remain manually selectable; partial assessments or gaps longer than seven days may result in Unknown.
The comparison summary shows the selected UTC endpoints and actual elapsed
time; Details expands comparison metadata. Reset comparison restores
the default 1D/latest-After intent, Changed result, All scopes, first
pages, and collapsed Custom/Details without changing Findings or Device Roster.
All scopes and Result
(default Changed) filter the entire comparison before paging. The table
reports the visible row range and matching-row count separately from the
unfiltered total, with First, Previous, direct page selection, Next, and Last
controls. Pages contain 25 rows; the table scrolls independently. Comparison
is available only when the server exposes comparison reads; unavailable
history, insufficient retained history, empty filter results, and failed reads
are reported separately. Processing stores adjacent and complete-only interval
pairs in hobat_v1.db; reads can also derive an unstored pair without writing.
See Thread Network Health for API, retention,
and comparison details.
The Logs workspace contains local Logs and Jobs tabs. Logs retains the newest 200 sanitized browser activity entries in memory only. Jobs lists active dataset, health, and device-action work and supports individual or confirmed bulk cancellation. Neither browser activity nor transient job state is persisted in the data directory.
Dashboard API calls are same-origin and do not receive CORS authorization
headers. When using a reverse proxy, serve the dashboard and /api/* through
the same browser origin (and the same path prefix when one is used). Changing
the bind host does not create an origin allowlist. This browser restriction is
not authentication: direct clients such as curl or wget can call any API
route they can reach, so use firewall or authenticated proxy controls when the
API must be restricted. This is especially important for roster lifecycle and
device diagnostic mutations.
The unified pending-job listing and bulk cancellation API are server-wide administrative operations. Browser confirmation prevents accidental bulk cancellation but does not authorize it; deployments outside a trusted network must protect these routes with an authenticated reverse proxy or equivalent access control.
Device Diagnostics are enabled by default: Ping and OTBR Reset Counters create
active network traffic. Use --disable-device-actions or
TD_DEVICE_ACTIONS_ENABLED=false to disable all diagnostic actions. Use
--disable-device-reset or TD_DEVICE_RESET_ENABLED=false to disable only
Reset Counters while retaining Ping. Environment values accept 1, true,
yes, or on to enable and 0, false, no, or off to disable; CLI
disable switches take precedence. Same-origin routing is not authentication,
so deployments beyond a trusted network require an authenticated reverse proxy
or equivalent firewall controls before exposing the server. Diagnostic results
are transient and are never written to the data directory.
Run commands from the repository root with PYTHONPATH=src:
PYTHONPATH=src python3 -m td_cli --help

# Fast OTBR CLI snapshots
PYTHONPATH=src python3 -m td_cli --datadir ./data otbr-cli router-table
PYTHONPATH=src python3 -m td_cli --datadir ./data otbr-cli meshdiag topology
PYTHONPATH=src python3 -m td_cli --datadir ./data otbr-cli networkdiag multicast-network

# Detailed OTBR CLI collection; may take minutes and reach sleepy devices
PYTHONPATH=src python3 -m td_cli --datadir ./data otbr-cli networkdiag fetch-all
PYTHONPATH=src python3 -m td_cli --datadir ./data otbr-cli networkdiag fetch-all \
  --children-ping-fallback
PYTHONPATH=src python3 -m td_cli --datadir ./data otbr-cli meshdiag routerneighbortable
PYTHONPATH=src python3 -m td_cli --datadir ./data otbr-cli meshdiag childtable
PYTHONPATH=src python3 -m td_cli --datadir ./data otbr-cli meshdiag childip6
PYTHONPATH=src python3 -m td_cli --datadir ./data otbr-cli topology

# Explicit active device operations; neither runs as part of collection or health processing
PYTHONPATH=src python3 -m td_cli otbr-cli device ping <thread device ipv6address> --json
PYTHONPATH=src python3 -m td_cli otbr-cli device reset-counters <thread device ipv6address> \
  --counters mac --confirm --json
# Host ICMP probe of one literal address; this does not determine Thread or Matter reachability
PYTHONPATH=src python3 -m td_cli system device ping --address 2001:db8::1 --attempts 2

# OTBR REST snapshots
PYTHONPATH=src python3 -m td_cli --datadir ./data otbr-restapi devices list
PYTHONPATH=src python3 -m td_cli --datadir ./data otbr-restapi devices fetch
PYTHONPATH=src python3 -m td_cli --datadir ./data otbr-restapi diagnostics fetch-all
PYTHONPATH=src python3 -m td_cli --datadir ./data otbr-restapi topology

# Home Assistant Matter Server snapshots
PYTHONPATH=src python3 -m td_cli --datadir ./data ha-matter-ws server-info
PYTHONPATH=src python3 -m td_cli --datadir ./data ha-matter-ws topology
PYTHONPATH=src python3 -m td_cli --datadir ./data ha-matter-ws all

# Other sources and processing
PYTHONPATH=src python3 -m td_cli --datadir ./data mdns thread
PYTHONPATH=src python3 -m td_cli --datadir ./data process-eve
PYTHONPATH=src python3 -m td_cli --datadir ./data health process-dataset \
  --dataset otbr_cli_networkdiag_fetch_all --dry-run
PYTHONPATH=src python3 -m td_cli --datadir ./data health migrate-history \
  --dataset all --policy-config-dir /absolute/path/to/server/config --dry-run --json
PYTHONPATH=src python3 -m td_cli --datadir ./data merge-dataset

# Health maintenance and complete data-directory backups
PYTHONPATH=src python3 -m td_cli --datadir ./data health purge --keep-days 30 --dry-run
PYTHONPATH=src python3 -m td_cli --datadir ./data system backups create --output ./hobat-backup
system device ping accepts only literal unicast IPv4 or IPv6 addresses. IPv6
link-local targets and zone identifiers require a later interface-aware design;
this command does not resolve names or change cached snapshots.
otbr-cli topology runs the complete CLI collection sequence. Detailed
networkdiag fetch-all and REST diagnostic sweeps are the highest-impact
commands; use cached snapshots for repeated analysis.
Dataset recipes, merge input groups, and source authority defaults are declared
in src/td-dataset-manifest.json (schema 2). The server loads it at startup and
serves it at GET /api/catalog with Cache-Control: no-store; the dashboard
uses a bundled snapshot if the catalog request fails. After editing the manifest,
regenerate the bundled fallback with python3 script/build_dataset_catalog.py
and restart the server. Health field ranks remain derived from the unchanged
rosterPolicy, so existing health observation policy digests remain valid.
The per-router OTBR CLI meshdiag table collectors automatically send one bounded two-attempt ICMPv6 probe to the queried router only after a table timeout or explicit OTBR error. The resulting snapshot records table and ping evidence separately; a ping reply does not make a failed table collection successful. The probe is skipped when a unique, valid mesh-local router target cannot be derived.
Default OTBR REST diagnostics fetch-all and topology sweeps retry known
terminal or no-result responses with progressively smaller, role-aware TLV
sets. Mesh sweeps retry failed combined requests as individual mesh TLVs and
may use a basic diagnostic to record responsiveness. Reduced-TLV recovery stays
partial when required detailed evidence is absent. Polling timeouts are never
retried because the original action may still be active. Use --no-fallback
to disable these additional bounded actions, or --fallback-preset to replace
the generic progression with one explicit fallback preset.
networkdiag fetch-all --children-ping-fallback is disabled by default. When
enabled, it sends one bounded ping to the derived RLOC address of each child
that did not answer any enabled Network Diagnostic policy. The child probe waits
up to 10 seconds to accommodate sleepy-device polling. An Echo Reply records
positive reachability, while no reply remains unknown and does not mark a sleepy
child offline. The same option is available on otbr-cli topology and applies
only to its networkdiag fetch-all step.
Network Diagnostic snapshots record tlvRequestValues as the largest
applicable request actually sent and tlvResponseValues as the cumulative
application-TLV coverage observed in complete response envelopes. Both are
numeric-sorted, distinct ID lists that exclude control IDs 32 and 33; null
means the evidence is unavailable, while an empty string means coverage is
known to be empty. Legacy cached tlvValues remains readable as request
metadata only. Router records without sufficient received coverage continue
through the existing bounded direct-diagnostic retry sequence.
otbr-cli device ping sends bounded active Thread traffic and returns one
complete result. Its default timeout is 3 seconds, or 10 seconds with
--allow-sed; an explicit --timeout overrides either default.
otbr-cli device reset-counters is destructive, requires an explicit counter
selection and --confirm, and only reports Done as local acceptance for
transmission, not remote confirmation. Health processing does not run these
active operations.
health process-dataset is cache-only: it never invokes a collector or modifies source
snapshots. Remove --dry-run to atomically store the observation and assessment
in the Hobat-wide hobat_v1.db; add --json for machine-readable output. Use --dataset all
to process every active browser dataset marked healthEligible: true; the shared
manifest is kept in lockstep with that registry contract. Offline assessment
requires an explicitly imported expected-device roster and two distinct complete
observations. See Thread Network Health.
health migrate-history is an explicit, backup-first maintenance operation for
replaying supported retained history; it does not collect data or infer missing
historical context from current snapshots. Stop health writers and consult
Thread Network Health before using it.
For health-eligible datasets, the dashboard reads the current stored assessment
through bounded, read-only /api/health/* routes. Run health process-dataset
after a successful cache collection to refresh the assessment shown by the browser.
Health purge commands support dry-run previews and require confirmation unless
--yes is supplied. system backups create uses SQLite's backup API and writes
a checksummed full-data-directory backup outside the active data directory.
Stop the web server and all writers before system backups restore; restore
validates and stages the backup before replacing the data directory. Backups
are unredacted and must be protected like the source data.
ha-matter-ws connects to ws://localhost:5580/ws by default. Set
TD_HA_MATTER_WS_HOST and TD_HA_MATTER_WS_PORT, or use --host and --port,
when Matter Server is reachable elsewhere. --uri overrides both host and port
with a complete WebSocket URI. It is read-only and
controller-scoped: only commissioned Matter nodes are visible, sleeping or
unavailable nodes may omit diagnostics, and Wi-Fi Matter nodes do not provide
Thread telemetry. This source complements OTBR network-wide collection rather
than replacing it. The dashboard serializes Matter refreshes and serves cached
snapshots until they are stale or explicitly refreshed.
See CLI Reference, OTBR REST CLI Reference, Thread Network Health, and Environment Variables.
The authoritative label map is td-static-extaddr-device-label.json. Each
record maps a 16-hex-digit extAddress to a deviceLabel:
[
  {
    "extAddress": "eeeaffeaffeaffe1",
    "deviceLabel": "Office Sensor"
  }
]
Select a device in the topology or table, open Device Settings, edit the label, and apply the change. Labels are trimmed, may contain Unicode display text, must be 1-128 characters, and cannot contain control characters. The server atomically inserts or updates the record. Concurrent writers in separate processes remain last-write-wins.
The same operation is available through the CLI:
PYTHONPATH=src python3 -m td_cli --datadir ./data \
  merge-extaddr --update-extaddr eeeaffeaffeaffe1 \
--device-label "Office Sensor"The published container starts the dashboard on port 9165. Mount a data directory and, only when OTBR CLI collection is required, the Docker socket:
docker run --name hobat -d \
  --network host \
  --volume "$PWD/data:/data" \
  --volume /var/run/docker.sock:/var/run/docker.sock \
  --restart unless-stopped \
  ghcr.io/jhawk42/hobat:latest
Set TD_OTBR_CONTAINER_USE=0 to run ot-ctl locally instead of through
docker exec.
For the Compose configuration, use the included environment example:
docker compose \
  --env-file examples/.env.docker.example \
  --file examples/docker-compose.yaml \
up -d --buildTo install Hobat on Home Assistant OS (HAOS):
- In Home Assistant, go to Settings > Apps > Install app.
- Open the three-dot menu, select Repositories, and add
https://github.com/jhawk42/hobat. - Select Hobat from the added repository and select Install.
- Follow the Home Assistant app documentation to configure Protection mode and optional OpenThread Border Router and Matter Server access, then start the app and select Open Web UI.
Home Assistant labels add-ons as "apps" in current UI releases. The app is
supported on amd64 and aarch64 HAOS installations.
The Matter WebSocket default requires the container to share the host network;
otherwise run the CLI with a reachable --uri.
The authoritative default suite is offline and treats checked-in data as immutable fixtures:
python3 -m pytest -qBenchmark and live checks are explicit opt-ins:
python3 -m pytest -q -m benchmark
TD_LIVE_TESTS=1 python3 -m pytest -q -m live
python3 -m pytest -q --cov
The live suite requires a configured OTBR environment. The default suite does not require OTBR, mDNS network access, Docker, or internet access.
If data/ is empty (for example, a fresh clone before any collection has run),
skip the small subset of tests that read checked-in snapshots from that
directory with the requires_data_dir marker:
python3 -m pytest -q -m "not requires_data_dir"Everything else builds its own isolated data directory with tmp_path and
--datadir/TD_DATA_DIR, so it does not depend on the contents of data/.
The cached adaptor contract test checks output shape, node styling pairs, and graph integrity without pinning network identities or counts to an older capture. Exact role-to-style behavior is covered by deterministic cases in the adaptor contract runner.