Panelist is a Rust library for writing Grafana dashboards as concise, strongly typed code.
use panelist::prelude::*;

let dashboard = dashboard! {
    title: "Service health";
    refresh: "30s";

    row "Traffic" {
        timeseries "Requests" {
            query: promql!("sum(rate(requests_total[$__rate_interval]))");
            unit: reqps;
            width: 12;
        }

        stat "Errors" {
            query: promql!("sum(rate(errors_total[$__rate_interval]))");
            unit: reqps;
            width: 12;
        }
    }
};

dashboard.validate()?;
dashboard.write_json("service.json")?;
# Ok::<(), panelist::Error>(())
Panel IDs, query reference IDs, and 24-column grid positions are assigned automatically and deterministically. The resulting JSON is stable enough to review in Git and close to Grafana's native dashboard model.
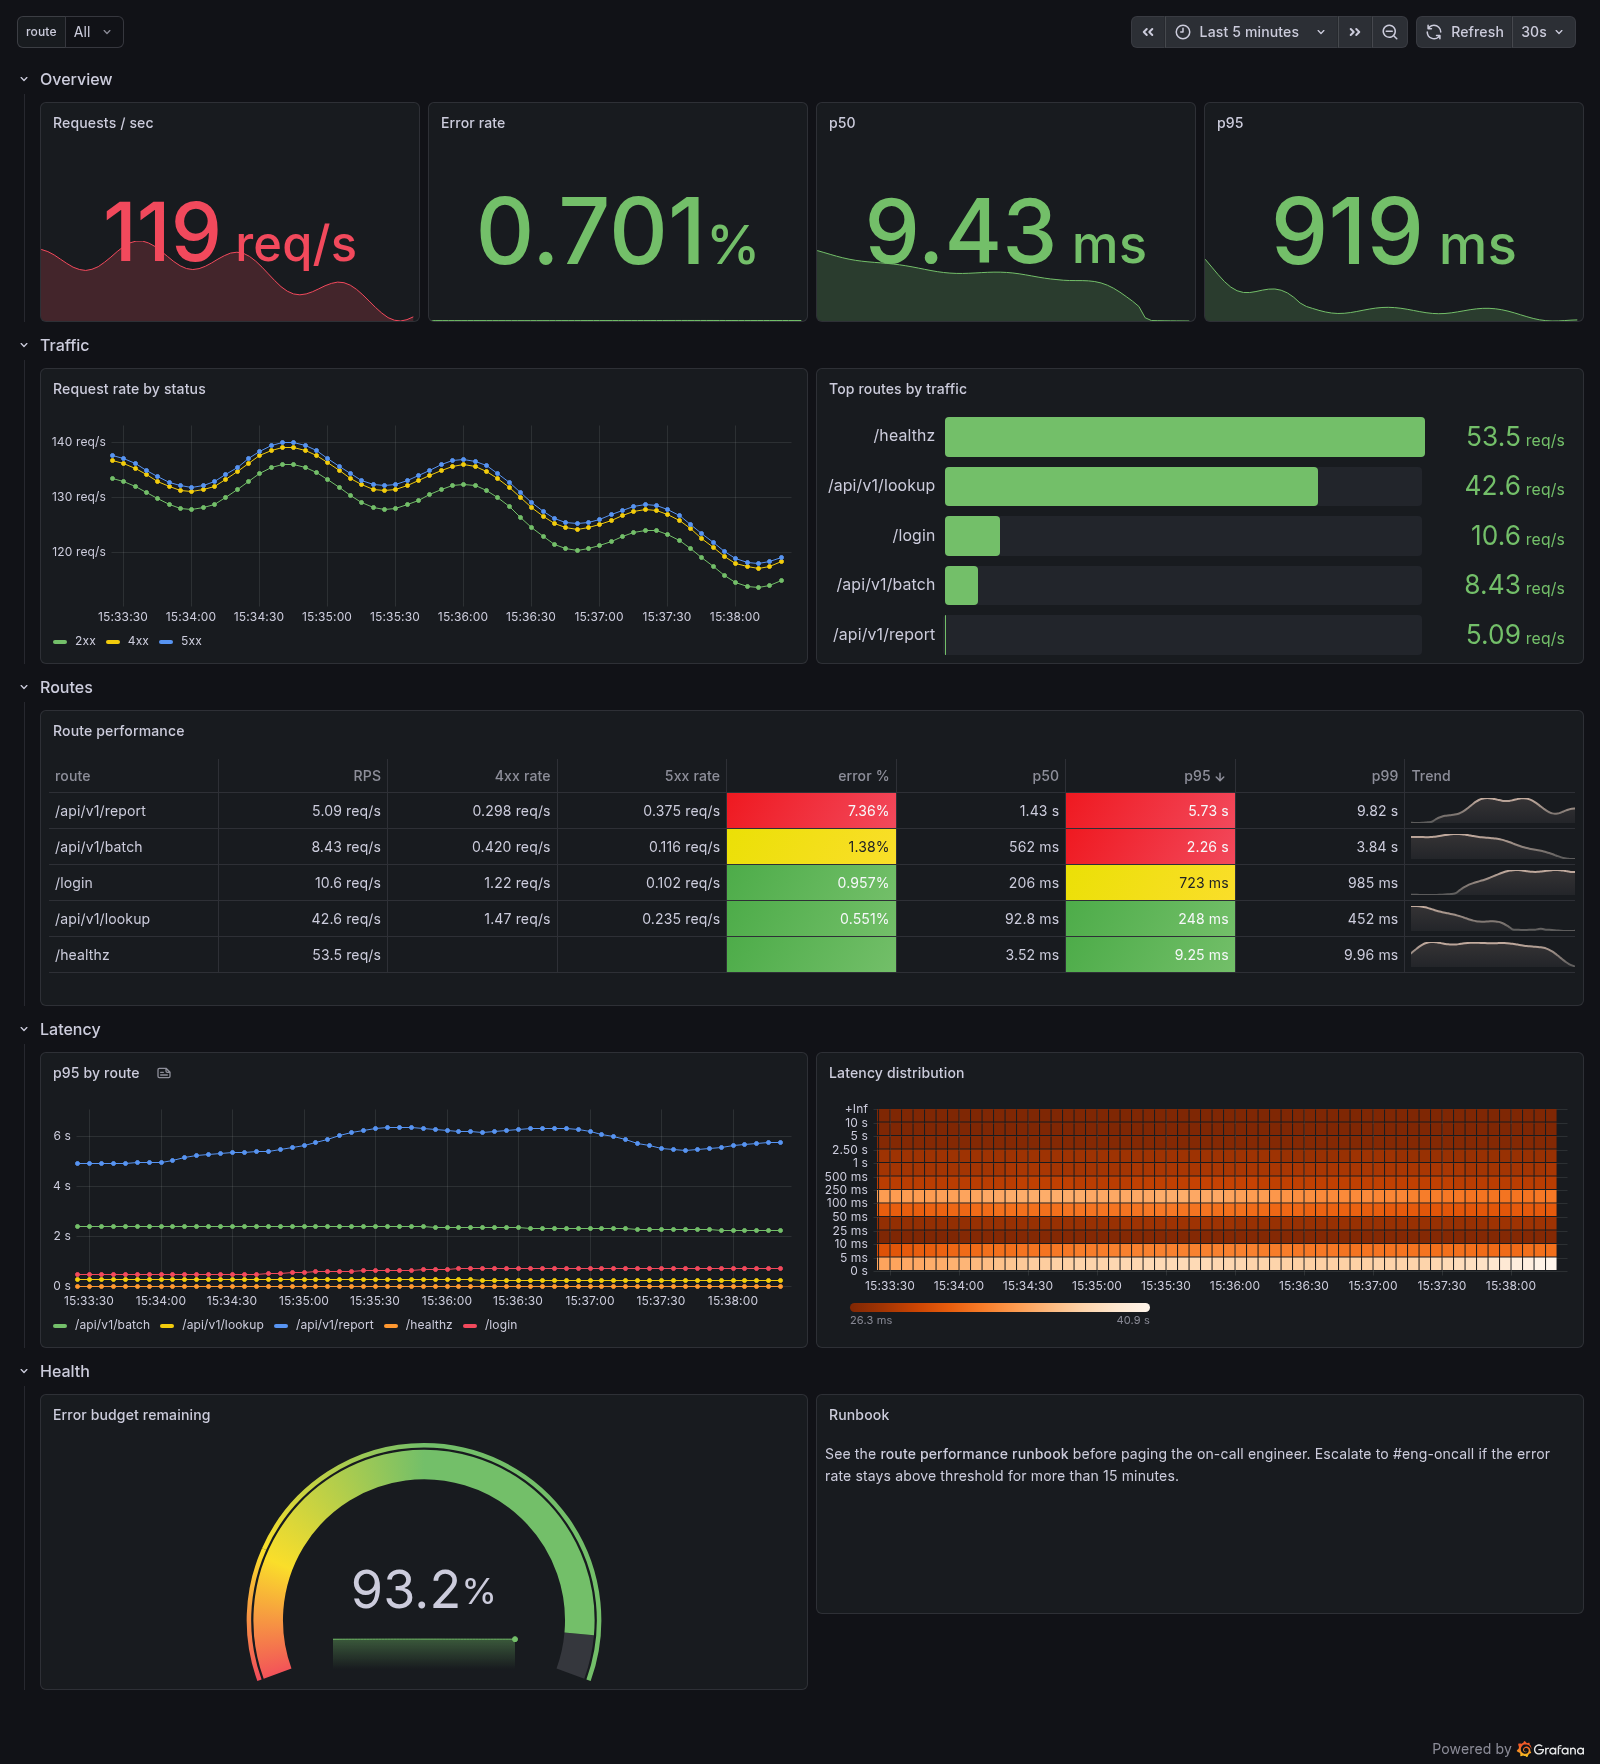
That screenshot is not a mockup. It is Grafana 13 rendering the output of
route_performance.rs, which
is regenerated by make render-examples. See the example
gallery for all six, or run make demo to click through
them on a live Grafana.
Panelist is under active development. Add the current release from crates.io:
[dependencies]
panelist = "0.3.0"
The minimum supported Rust version is 1.96. Panelist uses Rust 2024 and has no async runtime or network client dependency.
The macro translates a small amount of syntax into ordinary typed builders. It does not add loops, conditions, interpolation, or its own composition language: Rust remains the composition language.
use panelist::prelude::*;

let dashboard = dashboard! {
    title: "API";
    uid: "api";
    description: "API health and performance.";
    tags: ["api", "production"];
    refresh: "30s";
    datasource: prometheus("prometheus-main");

    variable "instance" {
        query: promql!("label_values(up{job=\"api\"}, instance)");
        multi: true;
        include_all: true;
    }

    row "Latency" {
        timeseries "Request latency" {
            query: promql!("histogram_quantile(0.99, rate(request_duration_seconds_bucket[$__rate_interval]))") {
                legend_format: "p99";
            }
            unit: seconds;
            width: 12;

            legend {
                position: bottom;
                mode: table;
                values: [last, min, max];
            }
        }
    }
};
# let _ = dashboard;
The DSL supports timeseries, stat, gauge, table, text, bar_gauge,
and heatmap panels at both dashboard and row level. promql! and loki!
create typed query builders rather than opaque JSON values.
Dashboard links, cursor sync, and the full variable surface are reachable too:
use panelist::prelude::*;

let dashboard = dashboard! {
    title: "API";
    cursor_sync: crosshair;

    link "Runbook" => "https://runbook.internal/api" {
        target_blank: true;
        tags: ["ops"];
    }

    variable "instance" {
        query: promql!("label_values(up, instance)");
        regex: "prod-.*";
        sort: alphabetical_asc;
        all_value: ".*";
        allow_custom_value: true;
        skip_url_sync: true;
        current "Production" => "prod";
    }
};
# let _ = dashboard;
A variable's kind comes from its selector: query:, plugin:, value:, or
values:. plugin: makes a datasource variable, and is distinct from
datasource:, which sets the datasource a query variable runs against:
use panelist::prelude::*;

let dashboard = dashboard! {
    title: "API";

    variable "source" {
        plugin: "prometheus";
        regex: "prod-.*";
        current "Main" => "prometheus-main";
    }

    variable "instance" {
        query: promql!("label_values(up, instance)");
        datasource: prometheus("prometheus-main");
    }
};
# let _ = dashboard;
Setting no selector, or more than one, is a validation error rather than a guess. So is an option the chosen kind has no Grafana key for.
regex and sort have no Grafana key on a custom or constant variable.
Setting them there is a validation error rather than a silent no-op, because
an ignored sort and a working one look identical in the emitted JSON.
Every typed panel option is reachable from the DSL. There is no option that
requires dropping to option "key": json!(…):
use panelist::prelude::*;

let dashboard = dashboard! {
    title: "Options";
    datasource: prometheus("prometheus-main");

    timeseries "Latency" {
        query: promql!("latency");
        fill_opacity: 30.0;
        line_width: 2.0;
        line_interpolation: smooth;
        show_points: never;
        span_nulls: true;

        tooltip {
            mode: multi;
            sort: desc;
        }
    }

    stat "Status" {
        query: promql!("up");
        color_mode: background;
        color: fixed(red);

        mapping "0" => "Down";
        mapping "1" => "Up" { color: green; }

        link "Runbook" => "https://runbook.internal/api" {
            target_blank: true;
        }

        reduce {
            calculations: [mean, max];
            fields: "/.*/";
        }
    }
};
# let _ = dashboard;
color_mode is shared between stat and heatmap panels and takes a different
vocabulary on each — value/background/none versus scheme/opacity.
The two sets are disjoint, so the right one is selected by what you write, and
pairing a panel kind with the wrong vocabulary is a compile error.
Table panels can transform, sort, and style their columns without leaving the DSL:
use panelist::prelude::*;

let dashboard = dashboard! {
    title: "Routes";
    datasource: prometheus("prometheus-main");

    row "Routes" {
        table "Route performance" {
            query: promql!("sum by (route) (rate(http_requests_total[$__rate_interval]))") {
                ref_id: "A";
                format: table;
                instant: true;
            }
            width: 24;

            transform organize {
                rename "Value #A" => "RPS";
                order ["route", "RPS"];
            }
            sort_by: ("RPS", desc);

            override field("RPS") {
                unit: reqps;
                cell: colored_background;
            }
        }
    }
};
# let _ = dashboard;
Table configuration stays typed throughout:
- Transformations:
join_by_field,sort_by,organize,time_series_to_table, andlabels_to_fields. Scope any of them to one query withonly ref_id(..). - Field matchers:
field(name),regex(pattern),type(field_type),query(ref_id),names([..]),numeric, andtime. - Cell renderers:
auto,colored_text,colored_background,gauge, andsparkline. Renderers with their own options also have block forms.
Set a default renderer with cell: <type>; on the table, or set one inside an
override for selected fields. For transformations Panelist does not model,
transform: <expr>; accepts a RawTransformation or Transformation value.
Heatmap panels configure their color scale and Y axis directly:
use panelist::prelude::*;

let dashboard = dashboard! {
    title: "Latency";
    datasource: prometheus("prometheus-main");

    row "Latency" {
        heatmap "Latency distribution" {
            query: promql!("sum by (le) (rate(request_duration_seconds_bucket[$__rate_interval]))") {
                format: heatmap;
            }
            unit: seconds;
            width: 12;
            color_scheme: "Oranges";
            color_steps: 64;
            cell_gap: 1;
            calculate: false;

            y_axis {
                unit: seconds;
                placement: left;
            }
        }
    }
};
# let _ = dashboard;Every important DSL construct has a normal Rust equivalent for IDE discovery, dynamic generation, and users who prefer builders:
use panelist::prelude::*;

let panel = Timeseries::new("Requests")
    .query(
        PrometheusQuery::new("rate(http_requests_total[$__rate_interval])")
            .legend_format("{{status}}"),
    )
    .unit(Unit::RequestsPerSecond)
    .width(12);

let dashboard = Dashboard::new("HTTP")
    .datasource(prometheus("prometheus-main"))
    .row(Row::new("Traffic").panel(panel));
# let _ = dashboard;
The typed API covers:
- dashboards, rows, datasources, time ranges, links, and persisted variable state;
- Prometheus and Loki queries, including time-series, table, and heatmap result formats;
- datasource, query, custom, and constant variables;
- field defaults, value mappings, thresholds, legends, overrides, and field matchers;
- transformations, table cells and sorting, heatmaps, and the common options for stat, time-series, gauge, and bar-gauge panels.
When Grafana supports something Panelist does not model yet, use RawQuery,
RawPanel, RawTransformation, or the ordered extra, option, and custom
methods.
Real-world provisioning metadata and visualization choices remain typed:
use panelist::prelude::*;

let dashboard = Dashboard::new("Operations")
    .schema_version(39)
    .version(1)
    .cursor_sync(DashboardCursorSync::Crosshair)
    .variable(
        DataSourceVariable::new("datasource", "prometheus")
            .current(VariableSelection::new("staging", "prometheus-staging")),
    )
    .panel(
        Timeseries::new("Requests")
            .query(
                PrometheusQuery::new("sum(rate(requests_total[5m]))")
                    .editor_mode(QueryEditorMode::Code),
            )
            .fill_opacity(10.0)
            .show_points(PointVisibility::Never)
            .tooltip(Tooltip::new().mode(TooltipMode::Multi)),
    );
# let _ = dashboard;Grafana dashboards use 24 columns. Panelist places panels from left to right,
wraps before a panel would exceed column 24, and advances following rows below
the tallest panel on each line. Defaults are visualization-specific; use
.width(), .height(), or width:/height: in the DSL to adjust them.
An explicit GridPos remains available for unusual layouts:
# use panelist::prelude::*;
let panel = Timeseries::new("Pinned")
    .grid_pos(GridPos::new(6, 10, 12, 8));
# let _ = panel;
Expanded rows serialize their panels at the dashboard level, as Grafana Classic expects. Collapsed rows retain their panels inside the row object and only consume the one-unit row header while collapsed.
Fragments are ordinary Rust values:
use panelist::prelude::*;

fn http_panels(service: &str) -> Vec<Panel> {
    vec![
        Timeseries::new("Requests")
            .query(PrometheusQuery::new(format!(
                "sum(rate({service}_requests_total[$__rate_interval]))"
            )))
            .into(),
        Stat::new("Errors")
            .query(PrometheusQuery::new(format!(
                "sum(rate({service}_errors_total[$__rate_interval]))"
            )))
            .into(),
    ]
}

let panels = http_panels("checkout");
let dashboard = dashboard! {
    title: "Checkout";
    row "HTTP" {
        panels: panels;
    }
};
# let _ = dashboard;Dashboard implements serde::Serialize, so normal serde_json APIs work.
The convenience methods add structured errors and file output:
# use panelist::prelude::*;
# let dashboard = Dashboard::new("Example");
dashboard.validate()?;
let compact = dashboard.to_json()?;
let pretty = dashboard.to_json_pretty()?;
dashboard.write_json("dashboard.json")?;
# let _ = (compact, pretty);
# Ok::<(), panelist::Error>(())
Validation reports duplicate explicit panel IDs and query refs, missing titles or expressions, invalid widths and positions, zero heights, and malformed threshold ordering. Invalid authored dashboards return errors instead of panicking.
Panelist emits Grafana Classic dashboard JSON with schema version 41. Classic
remains importable and exportable in Grafana 13, works with file provisioning,
and retains the numeric panel IDs and gridPos behavior that Panelist
automates. Grafana's newer V2 resource model uses a different layout
representation.
The authoring model, layout/normalization pass, and Grafana serialization model are separate modules so a future V2 serializer can preserve the DSL and builders. See the schema strategy for scope and references.
Six runnable examples live in crates/panelist/examples,
and each one prints its dashboard JSON:
cargo run -p panelist --example basicbasic.rs— smallest useful dashboardprometheus.rs— multiple targets, thresholds, overrides, and legend calculationsvariables.rs— query and custom variableslayout.rs— automatic wrapping and a reusable Rust fragmentfull_dashboard.rs— realistic GeoIP dashboard using Prometheus and Lokiroute_performance.rs— operational dashboard exercising panel transformations, typed table cells and sorting, Prometheus result formats, and heatmap options, with zero escape hatches
The gallery shows what each one looks like once Grafana
has rendered it. make demo boots Prometheus, Loki, and Grafana in Docker,
provisions all six from the examples themselves, and serves them on
http://localhost:3000; make render-examples regenerates the gallery
screenshots from that stack, so an image cannot drift from its example.
- Wire
scripts/verify-grafana.sh(make verify-grafana) into CI so every change is validated against a live Grafana 13 instance automatically; the check itself already exists and round-trips both golden dashboards cleanly today, it just isn't triggered on every push yet. - Add an opt-in Grafana V2 resource serializer and dynamic layouts.
- Add annotations, range/regex value mappings, and data links; add more transformation types beyond the five modeled today (join, sort, organize, time-series-to-table, labels-to-fields).
- Add more datasource query types without turning the core crate into an API client.
- Stabilize the API from real-world dashboard authoring feedback.
The repository is a Rust 2024 virtual workspace. Run make ci before sending a
change; it checks formatting, Clippy, builds, tests, rustdoc, source headers,
packaging, dependency licenses, and security advisories. See
CONTRIBUTING.md for the full workflow.
Panelist is licensed under Apache-2.0.