
Data pipeline health visualization library with a nervous system / star chart aesthetic.
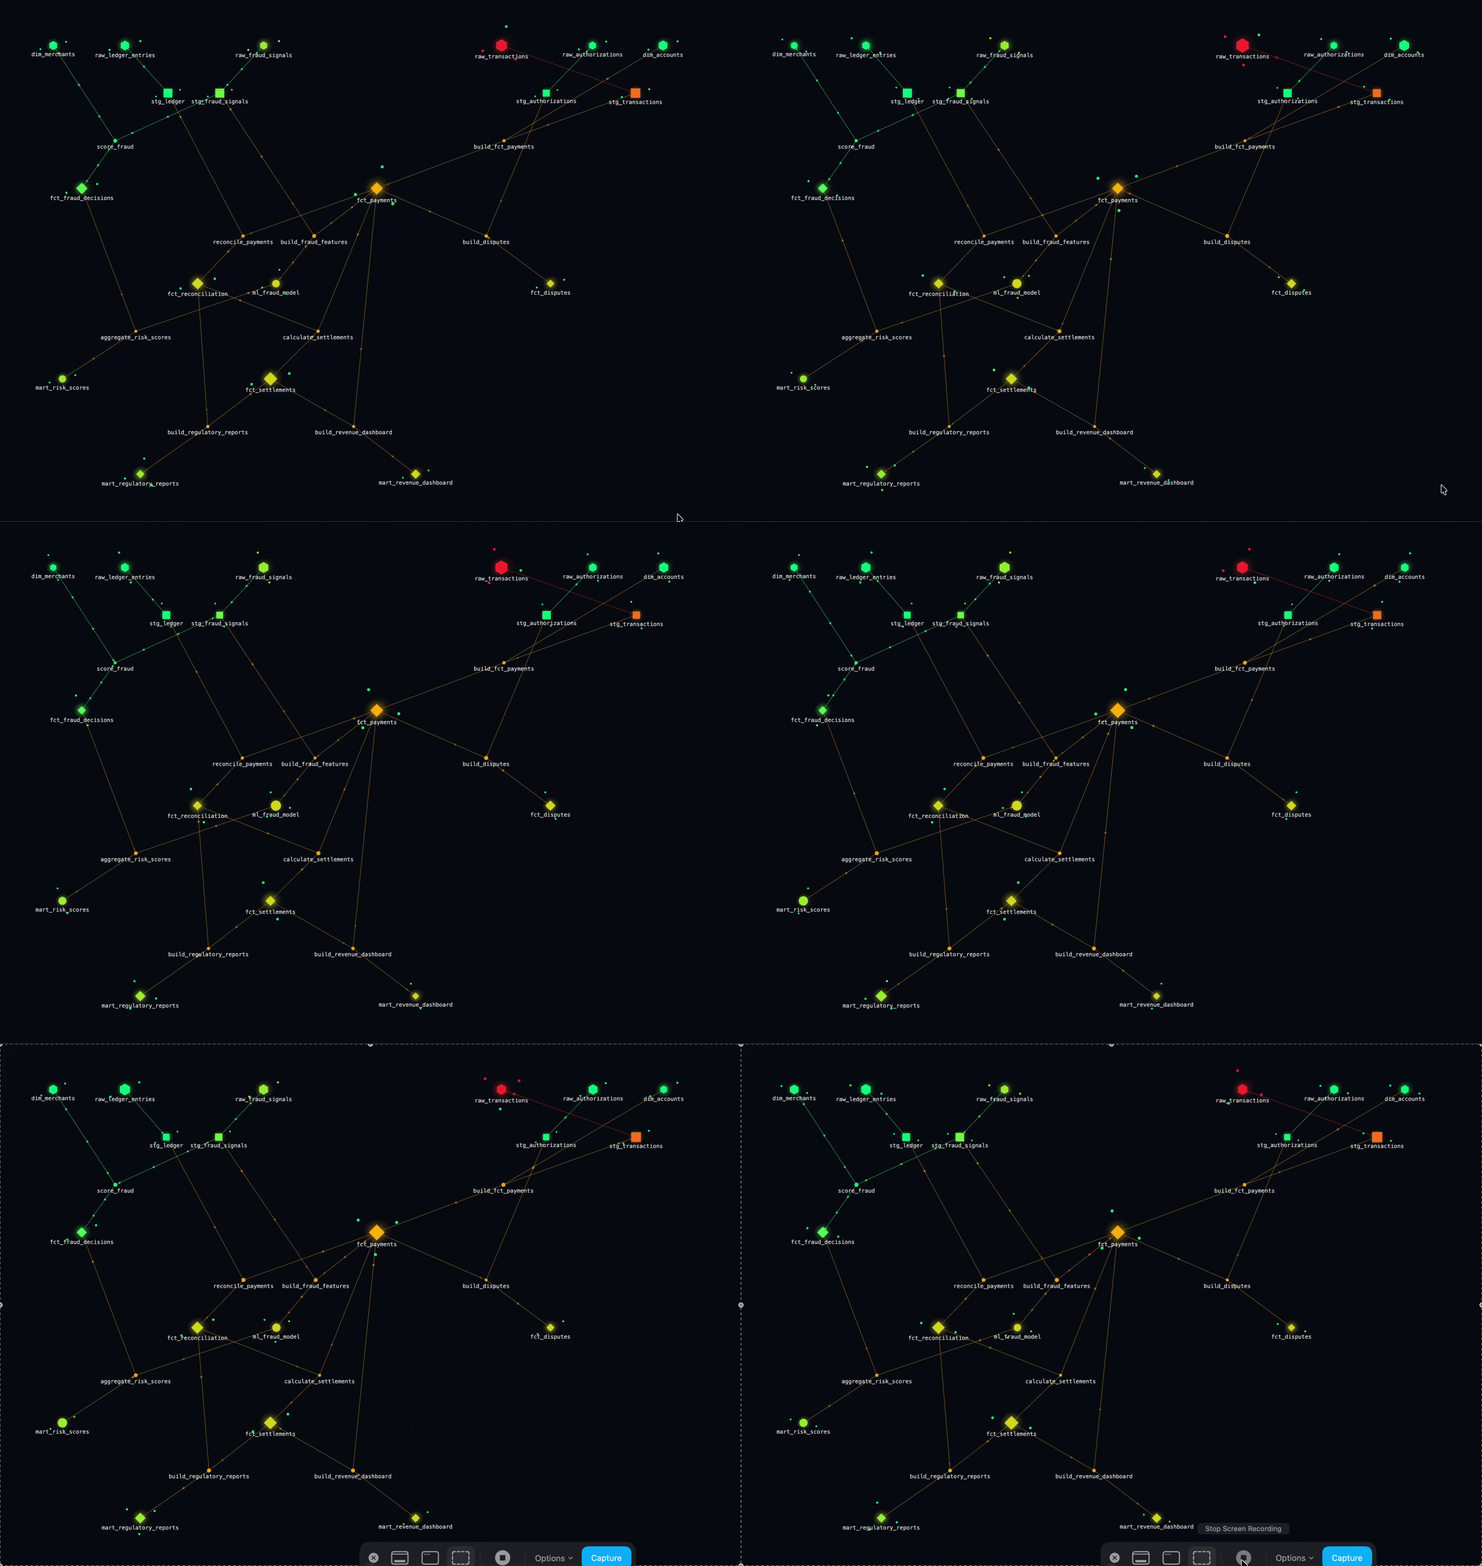
Visualizes tables, jobs, queues, APIs, or any operational dependency node connected by data pipelines, with live health status that propagates downstream through the graph using a configurable decay model. ClickHouse tables are a common source, but any node type works.
Framework-agnostic — works in any browser environment. Ships with force-graph and d3-force-3d as bundled dependencies.
npm install axon-graphimport { mountAxonGraph } from 'axon-graph';
const instance = mountAxonGraph(document.getElementById('graph')!, {
configUrl: '/api/axon',
pollInterval: 30000,
width: 1200,
height: 700,
});
// later — stops polling and removes the canvas
instance.destroy();Pass either configUrl (URL that returns RawGraph JSON) or getData (any async function returning RawGraph). mountAxonGraph owns the poll loop — no external state management needed.
Exactly one of configUrl or getData is required.
| Option | Type | Default | Description |
|---|---|---|---|
configUrl |
string |
— | URL polled on each interval; must return RawGraph JSON |
getData |
() => Promise<RawGraph> |
— | Custom async data source — use for reactive sources, in-memory data, or non-HTTP transports |
pollInterval |
number |
30000 |
Milliseconds between refreshes |
width |
number |
element width or 900 |
Canvas width in px — pass explicitly if mounting before first paint |
height |
number |
element height or 600 |
Canvas height in px — pass explicitly if mounting before first paint |
dagMode |
"td" | "bu" | "lr" | "rl" | "radial" | null |
"td" |
DAG layout direction — see DAG modes |
dagLevelDistance |
number |
max(120, height × 0.18) |
Pixel distance between DAG layers; overrides the default height-relative calculation |
onError |
(err: Error) => void |
— | Called on each fetch/getData failure; previous graph state is preserved |
Width/height note: clientWidth/clientHeight are read at mount time. If the element has not been laid out yet (e.g. mounted in a hidden container), they will be zero and the canvas will default to 900×600 with a console warning. Pass explicit width/height to avoid this.
| Method | Description |
|---|---|
destroy() |
Stops polling and tears down the canvas |
Known limitation: force-graph has no public cleanup method. destroy() wipes innerHTML to remove the canvas, but any window/document event listeners attached internally by force-graph will leak. This is acceptable for typical single-mount usage but can accumulate in apps that rapidly create and destroy many instances (e.g. React Strict Mode double-invocation). Track force-graph #1052 for upstream resolution.
// Static / already-fetched data
mountAxonGraph(el, {
  getData: () => Promise.resolve(myRawGraph),
});

// Meteor reactive computation
mountAxonGraph(el, {
  getData: () => new Promise((resolve) => {
    Tracker.autorun(() => resolve(GraphCollection.findOne()));
  }),
  pollInterval: 5000,
  onError: (err) => console.error('graph fetch failed', err),
});

// Custom transport with error visibility
mountAxonGraph(el, {
  getData: () => myGrpcClient.getGraph(),
  onError: (err) => toastService.error(`Graph unavailable: ${err.message}`),
});
React is not included — here's how to wrap the vanilla API in a component:
import { useEffect, useRef } from 'react';
import { mountAxonGraph, type MountConfig } from 'axon-graph';

export function AxonGraph(props: MountConfig) {
  const ref = useRef<HTMLDivElement>(null);
  useEffect(() => {
    if (!ref.current) return;
    const instance = mountAxonGraph(ref.current, props);
    return () => instance.destroy();
  }, [props.configUrl, props.getData, props.pollInterval, props.width, props.height]);
  return <div ref={ref} />;
}Spin up a local viewer pointed at a JSON config file:
npx axon-graph --config axon-graph.json
# or with a custom port
npx axon-graph --config axon-graph.json --port 3000
Opens http://localhost:4242 in your browser.
Use the engine directly without any rendering:
import { propagate } from 'axon-graph';
import type { RawGraph, ResolvedGraph } from 'axon-graph';

const raw: RawGraph = await fetchGraph();
const resolved: ResolvedGraph = propagate(raw);

// Each node now has:
// resolved.nodes[i].reportedStatus  — derived from checks ("healthy" | "failing" | "unknown")
// resolved.nodes[i].visualStatus    — what the graph should show (with upstream decay)
// resolved.nodes[i].visualReason — e.g. "Upstream signal from raw_events"Each node's reportedStatus is derived from its checks array — no explicit status field needed:
- No checks →
unknown - Any failing check →
failing - Any unknown check (with no failing) →
unknown - All healthy →
healthy
Scores: failing=1.0, unknown=0.0, healthy=0.0. unknown means "no signal — unmeasured, not unhealthy." It carries zero propagation weight and never degrades downstream neighbors.
Downstream propagation:
- Walk the graph from each
failingnode following outgoing edges (unknownandhealthynodes don't propagate) - At each hop, multiply the source's severity score by
decayFactor - At each target node, take the worst arriving influence score
- Convert score → status:
≥ 0.8 → failing,≥ 0.4 → degraded,≥ 0.1 → at_risk, else no change visualStatus= worst ofreportedStatusand the derived upstream status- Stop at
maxDepthhops
Fan-in (multiple upstream nodes → one target) is handled at the node level: when several edges share a target, the target picks up the worst arriving influence across those edges.
The dagMode field (in MountConfig or GraphConfig.dagMode in JSON) controls how the DAG layout arranges nodes. The layout engine respects edges as directed links and stratifies nodes into layers accordingly.
| Value | Layout | Best for |
|---|---|---|
"td" |
Top → bottom (default) | Classic pipeline DAGs — sources at top, sinks at bottom |
"bu" |
Bottom → top | Same as "td" but sinks at top; useful when the "output" is visually most important |
"lr" |
Left → right | Wide, shallow graphs or timelines read left-to-right |
"rl" |
Right → left | Mirror of "lr"; less common |
"radial" |
Radial from center | Hub-and-spoke topologies where one or few central nodes fan out |
null |
Pure force-directed (no DAG) | Graphs with cycles, or where hierarchical layout is not meaningful |
Note:
"radial"andnulldisable the strict layering constraint.nullremoves DAG mode entirely — useful when your graph has cycles that would otherwise cause force-graph to log a DAG cycle warning.
Breaking change: RawEdge.sources: string[] is replaced by RawEdge.source: string. An edge is now a single directed connection from one source to one target — the universal graph edge primitive. Fan-in and fan-out emerge naturally from multiple edges that share a target or source.
To migrate: split any edge that had multiple sources into one edge per source, each with a unique id, sharing the same target. For example:
// Before (0.5.x)
{ "id": "job_enrich", "sources": ["raw_events", "users"], "target": "events", ... }
// After (0.6.0)
{ "id": "job_enrich__raw_events", "source": "raw_events", "target": "events", ... },
{ "id": "job_enrich__users", "source": "users", "target": "events", ... }Propagation behavior is unchanged: a target with multiple upstream paths still picks up the worst arriving influence — that logic now operates across edges sharing the target rather than within a single edge's source list.
Per-node rendering is now self-describing. Two breaking schema changes:
- Replace each node's
"type": "<key>"with"shape": "hexagon" | "circle" | "diamond" | "square". - Remove the top-level
"nodeTypes"registry — it's gone.
If your old payloads used the nodeTypes[type].label field for grouping or labelling in your own UI, move that information into per-node meta (e.g. "meta": { "kind": "Warehouse" }).
- Force-directed, DAG-aware layout — direction configurable via
dagMode(default"td") - Node color = health-derived: green (healthy) → amber (degraded) → red (failing), driven by a continuous score-based gradient. Unknown nodes render gray — they are unmeasured, not unhealthy, and sit outside the gradient
- Satellites = small orbiting dots, one per health check, always visible
- Edges: thin solid lines; color driven by health; traveling pulse dots as the motion signal
- Info panel: click any node or edge to see
reportedStatusvsvisualStatuswith reason string and full check list
All types are exported from the package root:
import type {
RawGraph, ResolvedGraph,
RawNode, ResolvedNode,
RawEdge, ResolvedEdge,
ReportedStatus, VisualStatus,
HealthCheck,
NodeHealth, EdgeHealth,
NodeShape,
GraphConfig, PropagationConfig,
DagMode,
MountConfig, AxonGraphInstance,
} from 'axon-graph';curl -o axon-graph.json https://raw.githubusercontent.com/sean-kates/axon-graph/main/demo/axon-graph.json
npx axon-graph --config axon-graph.jsonOr clone the repo if you want all the demo files locally:
git clone https://github.com/sean-kates/axon-graph.git
npx axon-graph --config axon-graph/demo/axon-graph.jsonThe demo graph models a 19-node payment/fraud pipeline. raw_transactions is failing (two failing checks) and raw_fraud_signals is unknown (two unknown checks — vendor API is slow, no clean signal). The failing status propagates downstream from raw_transactions and renders amber/red on affected nodes; raw_fraud_signals renders gray and does not degrade its neighbors.
{
  "config": {
    "pollInterval": 30000,
    "dagMode": "td",        // optional — see DAG modes below; default "td"
    "propagation": {
      "decayFactor": 0.5,   // per-hop multiplier on influence score
      "maxDepth": 5         // max hops to propagate
    }
  },
  "nodes": [
    {
      "id": "events",
      "label": "events",
      "shape": "hexagon",
      // shapes: hexagon | circle | diamond | square
      "size": 2.0,
      "health": {
        "updatedAt": "2026-05-25T10:00:00Z",
        "checks": [
          {
            "name": "row_count",
            "status": "healthy",
            "message": "10k rows ingested",
            "checkedAt": "2026-05-25T10:00:00Z"
          }
        ]
      },
      "meta": {}
    }
  ],
  "edges": [
    {
      "id": "job_enrich__raw_events",
      "label": "enrich_events",
      "source": "raw_events",
      "target": "events",
      "health": {
        "checks": [
          {
            "name": "last_run_status",
            "status": "healthy",
            "message": "Job completed in 1m 12s",
            "checkedAt": "2026-05-25T09:00:00Z"
          }
        ]
      },
      "meta": {}
    },
    {
      "id": "job_enrich__users",
      "label": "enrich_events",
      "source": "users",
      "target": "events",
      "health": {
        "checks": [
          {
            "name": "last_run_status",
            "status": "healthy",
            "message": "Job completed in 1m 12s",
            "checkedAt": "2026-05-25T09:00:00Z"
          }
        ]
      },
      "meta": {}
    }
  ]
}